
Updated and edited January 21, 2024. Posted January 16, 2024.
Background
We’ve been working on this report on hate and bias incidents in Montgomery County Maryland for the last few years. This report is based on data from July 2022 through October 31, 2023.
It is important to note that the vast majority of these data was collected before the recent war in Israel/Gaza. We will be doing a follow up sometime later this year to see how things have changed since October 2023.
Data Sources
Data sets were sourced from the Month to Month Hate Bias summaries from the Montgomery County Police Department here: Hate, Bias Summaries, Montgomery County Police Department, Montgomery County, MD (montgomerycountymd.gov)
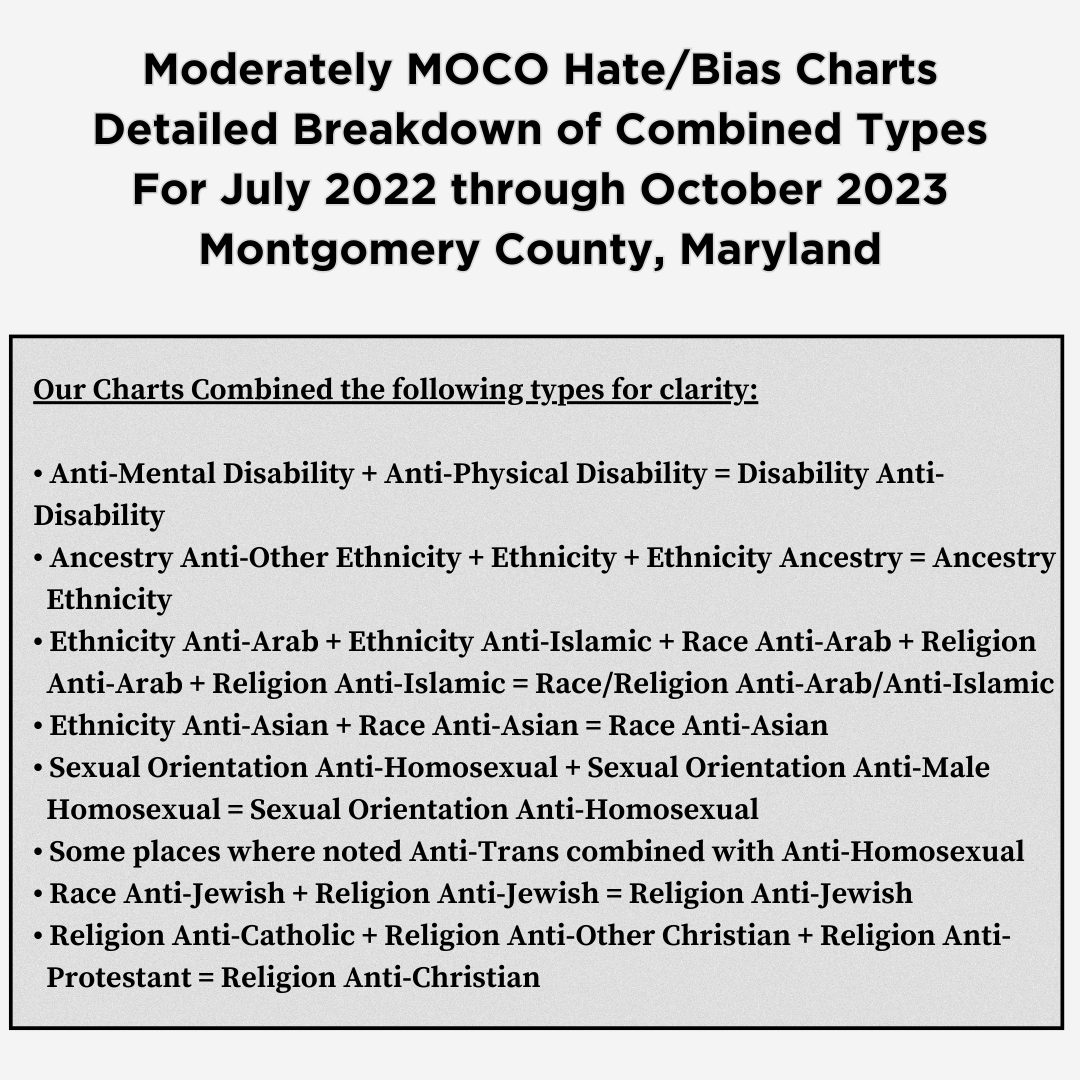
Note that some common categories were combined to make charts easier to read. The full details of which categories were combined can be found here or later in this post.
Charts on Hate/Bias Incidents in Montgomery County
County Wide
County wide, anti-Jewish hate/bias incidents made up 38% of all reports, anti-Black hate/bias incidents made up 29% of all reports and anti-Homosexual hate/bias incidents made up 11% of all reports (for schools we combined this last category with other anti-Trans/anti-Homosexual hate/bias incidents).

Cumulative
The cumulative charts, illustrate the total number of hate/bias incidents since the start of the reporting period, which is July 2022, and show their increase over time.

Month to Month
The Month to Month chart, below, shows just the number of hate/bias incidents that occurred in a given month. You can see that even in the overall county numbers, it is easy to see when schools are in session by the spikes in the chart (more on that later)
Advertisement

Schools Incident Data
This section isolates just incidents at schools that were reported to the Montgomery County Police Department (the data include mainly incidents from @MCPS but also from all other schools in county). Notably, 61% of all incidents at schools were anti-Jewish despite the fact that Jews make up a significantly smaller portion of population (more on that under “Population Data and Estimates”).
Anti-Black and anti-homosexual/anti-trans incidents round out the top three total of the police incident reports.

Cumulative Data from Montgomery County Schools
For the cumulative charts, we show the total number of hate/bias incidents since the start of the reporting period July 2022, and show how the incidents increased over time.

Cumulative Number of Hate/Bias Incidents (Just worst three)
Because it is a little hard to read the chart above, we isolated just the worst three groups, that is, the groups with the most reported hate/bias incidents, for this chart below.

Month to Month Data within Montgomery County Schools
For the Month to Month charts, we show just the number of hate/bias incidents that occurred in a given month.

Potential Biases
Some information especially in the county wide data may be influenced by how likely someone is to report the crime. According to Moco360, during the anti-hate task force meetings, “representatives from every cohort explained that hate incidents are underreported because people either do not know how or where to submit reports or their reports are not taken seriously and addressed” However, the schools data are based on reports by school administration and presumably faces less of these biases.
Note that in cases such as the Paint Branch High School antisemitism claims by the leader of the Muslim Student Association, there was no report because there was no physical evidence and it was disputed what was said. This could partially explain the massive number of antisemitism reports compared to others that many lack incidents physical evidence of a hate/bias incident such as the physical drawing of swastikas or racial slurs.
Schools are required to report hate and bias incidents so that could be a part of why there are so many more when schools are in session. This however seems to indicate pervasive hate and bias in Montgomery County schools (primarily MCPS) which probably are severely undercounting the actual numbers. These issues need to be addressed thoroughly by school administration from the top down.
More Background Articles
There is a lot of additional information in the Montgomery County Police Department’s 2022 Hate Bias incident report. That report sparked a few articles in Moco360 such as “County sees highest number of hate incidents in 10 years”, “Spike in MCPS hate bias reports prompts mandatory training for administrators”
In August 2023, the Washington Jewish Week wrote about the 400% increase in hate/bias incidents.
Population Data and Estimates
Because Jews are not counted as a race by Census data nor by MCPS, they are typically counted within a fraction of the White race in the counts by MCPS and County data. There is debate among the Jewish community as to whether Jews are a race, ethnicity or religion so we will not get into that here, but this makes purely attempting to look at the numbers of Jews in MCPS or Montgomery County difficult.
The MCPS “About” page and “At a Glance” for the whole school system (as of October 2023) have slightly different numbers but they are close enough to each other that we share both below.

Considering that Jews are a portion of the White race for this MCPS data, we can assume that it is probably well under half (so conservatively under 12%) and yet anti-Jewish hate/bias incidents make up 61% of the hate/bias incidents in schools during this time period.
Advertisement
Anti-Black hate/bias incidents make up very slightly more than their percent of the population but the percentages are a very close match. Every other racial group that is counted here has a significantly less number of hate/bias incidents against them compared to their population.
Looking at county wide numbers, it is somewhat difficult to accurately estimate the number of Jews in Montgomery County (similar to the reasons discussed above). At one point the number of Jews in the county was estimated to be around 10% of the population but considering the growth in diversity and shrinking proportion of White people in the county (the category in which Jews are counted), this seems unlikely now.
Some studies have been done in the past five to ten years but nothing has been completed more recently. Instead of getting into the details we will share with you the sources of one such study “The 2017 Greater Washington, DC Jewish Community Demographic Study”. The key findings begin on Page 1 in the Executive Summary which we highlight below estimated that Jews make up 6% of the Greater Washington DC areas population. It would seem that Washington DC proper and Montgomery County would be a larger proportion of those Jews than other areas. Note that this study dates from 2017 and also that the Washington Jewish Week wrote a piece about this study and what it can and cannot tell us. It is also worth noting that at that time, 2017, 7% of the area’s Jewish population identified as LGBTQ, and 7%, as Hispanic/Latino.

As a comparison, for overall Montgomery County racial demographics, the chart below from the U.S. Census data Estimates (as of July 1, 2022) provides data.S
You can see that the overall county racial demographics vastly differ from those in the schools’ demographics with a much higher number of White people, much less Hispanic or Latinos, and a relatively comparable ratio of Black or African American, Asians, and Two or more races (each within a few percentage points).

Combined Categories

Conclusions
When looking at the Month to Month charts compiled here, it becomes clear that when schools are open there is a large increase in hate/bias incidents. Schools are required to report these incidents whereas others are not but this is still very concerning. It is also likely that there is under-reporting from MCPS, based on anecdotal evidence.
Anti-Jewish hate/bias incidents are by far the greatest type of hate/bias incidents within the county and in particular, in our county schools. When you add to this data driven conclusion the consideration of the size of the Jewish population, the antisemitism looks even more pervasive.
Anti-Black hate/bias incidents make up the highest percentage of those outside schools where individuals were targeted.
Anti-Trans and anti-Homosexual hate/bias incidents while smaller in number, are also targeting a smaller amount of people by percentage in the county population.
All of these groups have historically faced discrimination and the data clearly shows they are presently facing issues in our County and especially in our schools. To address racism within MCPS, the MCPS administration initiated the anti-Racist audit (which excluded Jews despite repeated efforts by Jewish groups such as the Montgomery County Jewish Parents Coalition, among others, to include Jews). As a comparison of concern and care, MCPS also has outreach and funding to support students with various gender identities and sexualities within their system. This support includes an entire section of their website, list of inclusive resources, and documents such as those about “Inclusive and Welcoming Learning in MCPS”. There is no similar care or support for Jewish students that we see on the MCPS website.
It is not clear what MCPS has been doing and will do to ensure that Jewish students and staff feel safe amongst the rising tide of anti-semitism that has been steadily increasing in recent years in MCPS and across the county, a startling increase even before the October 7, 2023 war in Israel began. There are recent very public events in MCPS which we’ll specifically not discuss here as we look at the bigger picture, because it would take a whole article of its own to list and discuss.
We do not look forward to the follow up report which will look at how these hate/bias incidents have trended since October 2023.
Related Posts
Recent Posts
- MCPS Bid to Dismiss Wootton School Challenge Rejected as Case Moves Forward Before Administrative Judge
- Live Music This Week in Montgomery County: July 16–19
- Review of “Pete the Cat, A Live Rock Musical” Rocks Imagination Stage with Music, Laughs & Big Life Lessons
- The Reluctant Resurrection of Sherlock Holmes by Montgomery Playhouse is a hit!
- DMV Coalition Launches Petition Seeking Moratorium on AI Use in Schools
- Summer 2026: Live From the Lawn, Cool Concerts for Kids, Strathmore Presents at the Music Center, Bloom at Good Hope Concerts
- Montgomery County to Certify 2026 Primary Election Results Wednesday
- Opening this Saturday, June 27. Sister Act by Rockville Musical Theatre at The F. Scott Fitzgerald Theater. Use code: MOCOFRIEND for 15% off regular price tickets!
- Who Will Win the Final At-Large County Council Seat? The Math Behind Montgomery County’s Closest Race
- Why the Montgomery County Executive Race Has Not Been Called Yet: The Math Behind the Jawando-Friedson Race
- What to Expect on Election Night in Montgomery County
- Hamza Khan – Candidate for County Council At-Large (Moderately MOCO Candidate Introduction Series)
- Conflicting Accounts Emerge After Altercation at Bohrer Park Early Voting Site; Assault Summons Issued
- Sheriff Maxwell Uy Seeks Reelection, Highlights Experience, Leadership, and Community Service
- Montgomery County Student Reflects on Leadership, Service, and Friendship at Maryland HOBY Seminar
1 Comment
Comments are closed.