
Advertisement
Our preseason model ranks all 25 Montgomery County public school teams, projects their wins and identifies the games that could shape the season.
Every game, over and over. Teams get hot, favorites lose, upsets change the outlook for the weeks that follow, and by the end of it we have 10,000 different versions of how the season could play out.
Run it once and you get a prediction. Run it 10,000 times and you start to get a much better picture of what is likely, what is possible and what would be genuinely surprising.
The biggest takeaway from our preseason projections probably won’t surprise anyone who followed Montgomery County football last year. Quince Orchard is still the team to beat.
QO went 9-0 during the 2025 regular season and starts 2026 at No. 1 in our computer rankings. The model projects an average of 9.5 wins and has Quince Orchard finishing somewhere between 8 and 10 wins in most simulations. QO also finishes as a Top 3 team in 94% of the 10,000 seasons we simulated.
Sherwood starts at No. 2 after an 8-1 regular season, followed by Churchill, Damascus and Northwest.
These rankings are the first release from a system we’ve been building to follow Montgomery County football throughout the season. Once games begin, we’ll update the rankings and projections weekly as actual results give the model new information to work with.

Advertisement
The 2026 Preseason Top 10
| Rank | Team | 2025 Regular Season | Projected Wins | Range | Top-3 Odds |
|---|---|---|---|---|---|
| 1 | Quince Orchard | 9-0 | 9.5 | 8-10 | 94% |
| 2 | Sherwood | 8-1 | 7.5 | 6-9 | 55% |
| 3 | Churchill | 8-1 | 6.8 | 5-8 | 34% |
| 4 | Damascus | 6-3 | 7.0 | 4-9 | 26% |
| 5 | Northwest | 5-4 | 5.9 | 3-8 | 23% |
| 6 | Paint Branch | 7-2 | 5.9 | 4-8 | 14% |
| 7 | Blake | 5-4 | 5.5 | 3-8 | 9% |
| 8 | Richard Montgomery | 6-3 | 5.5 | 2-8 | 7% |
| 9 | Bethesda-Chevy Chase | 6-3 | 5.0 | 2-8 | 8% |
| 10 | Kennedy | 5-4 | 6.2 | 3-9 | 12% |
2025 records shown are regular season only so they line up with what we’re projecting for 2026.

Projected Wins and Power Rankings Aren’t the Same Thing
There is an important distinction in these numbers that becomes obvious when you look at Kennedy.
Kennedy is ranked No. 10 but averages 6.2 wins in our simulations, which is more than Northwest, Paint Branch, Blake, Richard Montgomery and Bethesda-Chevy Chase. That isn’t an error. Kennedy also has one of the softest projected schedules in the county.
The power ranking is meant to measure how good we think each team is, while projected wins also have to account for who that team actually plays. Those two things don’t always produce the same order.
Blake provides a good example in the opposite direction. We have Blake ranked No. 7 with 5.5 projected wins, but the Bengals face a much tougher schedule. A team can play good football and finish around .500 if it spends the season facing stronger opponents.
Schedule strength doesn’t erase wins or losses, and the model still gives teams credit for winning the games in front of them. It does give us some needed context in a county where schedules can vary significantly from one school to another.
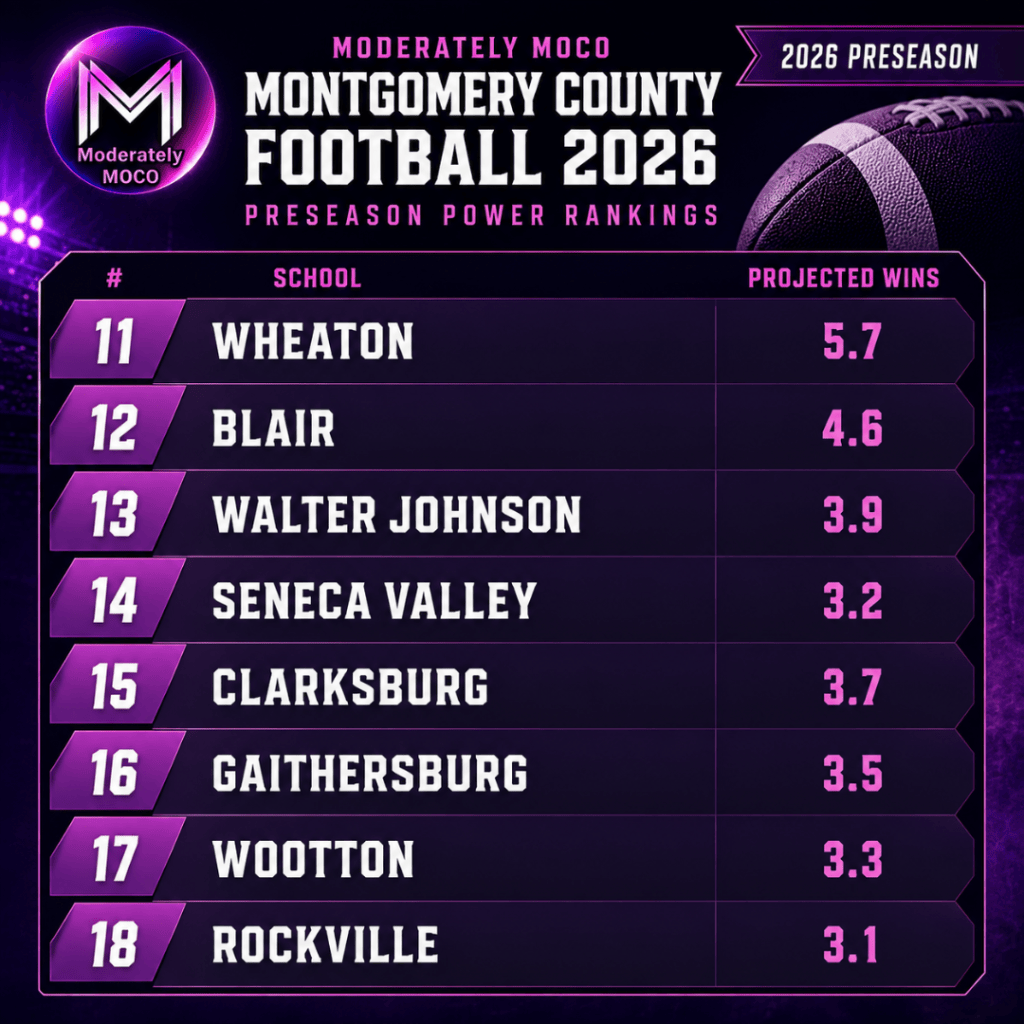
Some 2025 Records Look Different With Schedule Strength Added
Northwest may be the most interesting example near the top of the rankings. The Jaguars finished 5-4 last year but begin this season at No. 5 in our rankings after playing what the model rates as the toughest schedule in the county.
Wheaton went 7-2 and starts at No. 11. The Knights had one of the county’s softest schedules last season and face another relatively favorable schedule this year. A 7-2 season is still a very good season, but the computer doesn’t treat a win-loss record as if every team took the same path to get there.
Poolesville is another example farther down the rankings. The Falcons went 4-5 last season against the third-softest schedule in the county and enter 2026 at No. 22.
This is also where the rankings should become more useful once the season starts. We’ll have actual 2026 results to work with every week, and we’ll be able to see whether teams are performing differently than the preseason model expected.
The Full Preseason Rankings
| Rank | Team | 2025 | Projected Wins | Range | Top-3 | Schedule |
| 1 | Quince Orchard | 9-0 | 9.5 | 8-10 | 94% | Brutal |
| 2 | Sherwood | 8-1 | 7.5 | 6-9 | 55% | Tough |
| 3 | Churchill | 8-1 | 6.8 | 5-8 | 34% | Brutal |
| 4 | Damascus | 6-3 | 7.0 | 4-9 | 26% | Tough |
| 5 | Northwest | 5-4 | 5.9 | 3-8 | 23% | Brutal |
| 6 | Paint Branch | 7-2 | 5.9 | 4-8 | 14% | Tough |
| 7 | Blake | 5-4 | 5.5 | 3-8 | 9% | Tough |
| 8 | Richard Montgomery | 6-3 | 5.5 | 2-8 | 7% | Average |
| 9 | Bethesda-Chevy Chase | 6-3 | 5.0 | 2-8 | 8% | Tough |
| 10 | Kennedy | 5-4 | 6.2 | 3-9 | 12% | Very Soft |
| 11 | Wheaton | 7-2 | 5.7 | 3-8 | 7% | Very Soft |
| 12 | Blair | 4-5 | 4.6 | 2-7 | 3% | Average |
| 13 | Walter Johnson | 4-5 | 3.9 | 1-7 | 2% | Brutal |
| 14 | Seneca Valley | 4-5 | 3.2 | 1-6 | 1% | Brutal |
| 15 | Clarksburg | 4-5 | 3.7 | 1-6 | 1% | Tough |
| 16 | Gaithersburg | 3-6 | 3.5 | 2-6 | 0% | Tough |
| 17 | Wootton | 3-6 | 3.3 | 1-6 | 1% | Tough |
| 18 | Rockville | 2-7 | 3.1 | 0-6 | 0% | Tough |
| 19 | Magruder | 2-7 | 2.1 | 0-5 | 0% | Tough |
| 20 | Whitman | 3-6 | 2.1 | 0-5 | 0% | Tough |
| 21 | Einstein | 2-7 | 2.8 | 0-5 | 0% | Soft |
| 22 | Poolesville | 4-5 | 2.5 | 0-5 | 1% | Very Soft |
| 23 | Northwood | 3-6 | 2.0 | 0-5 | 1% | Very Soft |
| 24 | Watkins Mill | 1-8 | 1.8 | 0-4 | 0% | Soft |
| 25 | Springbrook | 0-9 | 1.7 | 0-4 | 0% | Average |

Five Games Worth Circling
The simulations also give us a way to look ahead at individual games. We pulled out five matchups between competitive teams where the model sees a meaningful chance for either side.
Paint Branch at Northwest, September 25: Northwest is projected to win by about 3 points, but wins only 59% of the simulations. That’s one of the closest games on the preseason schedule.
Northwest at Churchill, September 10: Churchill is projected to win by about 6 and has a 69% win probability.
Bethesda-Chevy Chase at Blake, October 16: Blake is projected to win by about 4, with a 61% win probability.
Seneca Valley at Walter Johnson, October 2: Walter Johnson is projected to win by only about 2 points and wins 57% of the simulations.
Advertisement
Paint Branch at Churchill, October 30: Churchill is projected to win by about 8, with a 73% win probability.
These are preseason numbers and shouldn’t be treated as predictions carved in stone. By the time some of these teams meet in October, we’ll have weeks of new results and a much better idea of what they actually look like in 2026.

How We Built the Rankings
The rankings come from an internal model that weighs team results, scoring performance, opponent strength, recent performance and schedule difficulty. The preseason projection system then takes those ratings and simulates the season 10,000 times.
The simulations aren’t simply 10,000 repetitions using the exact same team ratings. Results within a simulated season feed back into the ratings used for later games, and the system also accounts for uncertainty about how good each team actually is.
That uncertainty is especially important in the preseason. High school rosters change, players develop, seniors graduate and teams can look considerably different from one year to the next. The projected ranges are meant to reflect that rather than give a false sense of precision based on an average such as 5.9 or 7.5 wins.
We also tested the projection system against the previous 10 completed seasons. When making projections before the first game of the season, the model finished an average of about 1.6 wins away from teams’ actual final records. About nine times out of 10, the final win total fell within the projected range.
Moderately MOCO intern Yvan Motsebo Chefor has been part of this effort, helping build out the ranking system and develop the ideas behind how we’re using the data. This has been an ongoing project, and we’ll continue refining the system as we get more results and see how the projections perform in real time.
New Rankings Every Week
The preseason rankings are the starting point. Once the season begins, we’ll update the system each week with the latest results, rerun the projections and publish new power rankings.
That should give us more than a list of who moved from No. 7 to No. 5. We’ll be able to track how a big win or upset changes a team’s projected season, which schedules look harder or easier than they did in August, and which upcoming games the simulations think are closer than they might appear.
We’ll also highlight a weekly toss-up and some of the games the model thinks are most worth watching.
More Sports Coverage Coming Through Capital Sideline
The football rankings will also be part of a larger expansion of our local sports coverage.
We’re building Capital Sideline, a sports-focused sub-brand that will give us a dedicated home for local sports coverage, rankings, data, photos and other stories. The website is still under construction and isn’t quite ready for prime time, so for now we’ll continue publishing and sharing this coverage through Moderately MOCO.
We’ll have more to share about Capital Sideline as that comes together. In the meantime, we’ll be following Montgomery County football throughout the 2026 season and putting the projection system to the test every week.
Preseason projections generated August 5, 2026. Rankings and projections will be updated weekly during the 2026 season.
I appreciate your work on this, even if I don’t agree with where they landed. You explained the logic and this will be fun to follow. I am curious of you came up with the schedule rankings (soft – brutal)? Based on past performace of the teams on the schedule? Will that be updated as the reality of the season unfolds and impact the rankings?
Yea the tool helped come up with that … basically based on the past performance of the teams they are scheduled against. The schedule rankings will be updated as season comes into play but also the actual scores happening will help us get much more accurate readings on how teams are this year even in just a week or two.